The short answer
Video completion rate is the share of video starts that play to the end. Google Ad Manager defines it as video completes divided by video starts, and gives a simple example: if one viewer watches all of a 20-second video and another stops after 10 seconds, the completion rate is 50 percent, one complete for two starts. The definition sounds settled, but the denominator is not the same everywhere. Some tools divide by starts, others by plays or by impressions, and a figure based on impressions will be lower than one based on starts for the same viewing. Before comparing two completion rates, check what each tool counts as a start, what counts as a complete and which number sits underneath the percentage.
How players count starts and completes
For video ads, the IAB Tech Lab's VAST specification sets the events most players report. In VAST 4.3, start indicates that a creative was loaded and playback began. firstQuartile, midpoint and thirdQuartile mean the creative played continuously for at least 25, 50 and 75 percent of its duration at normal speed, and complete means it was played to the end at normal speed. A progress event with an offset, given as a time or a percentage, can track any other agreed point. For editorial video on the web, the browser supplies the raw signals. The HTML media element fires timeupdate as the current position changes, between about 4 and 66 times per second depending on system load, and fires ended when playback reaches the end of the media. Two details matter in practice: ended does not fire when the video is set to loop, and a timeupdate handler that waits for an exact position can miss it. Most analytics integrations therefore record a complete when the position passes a threshold close to the end, and record each milestone once per view.
Quartiles show where viewers leave
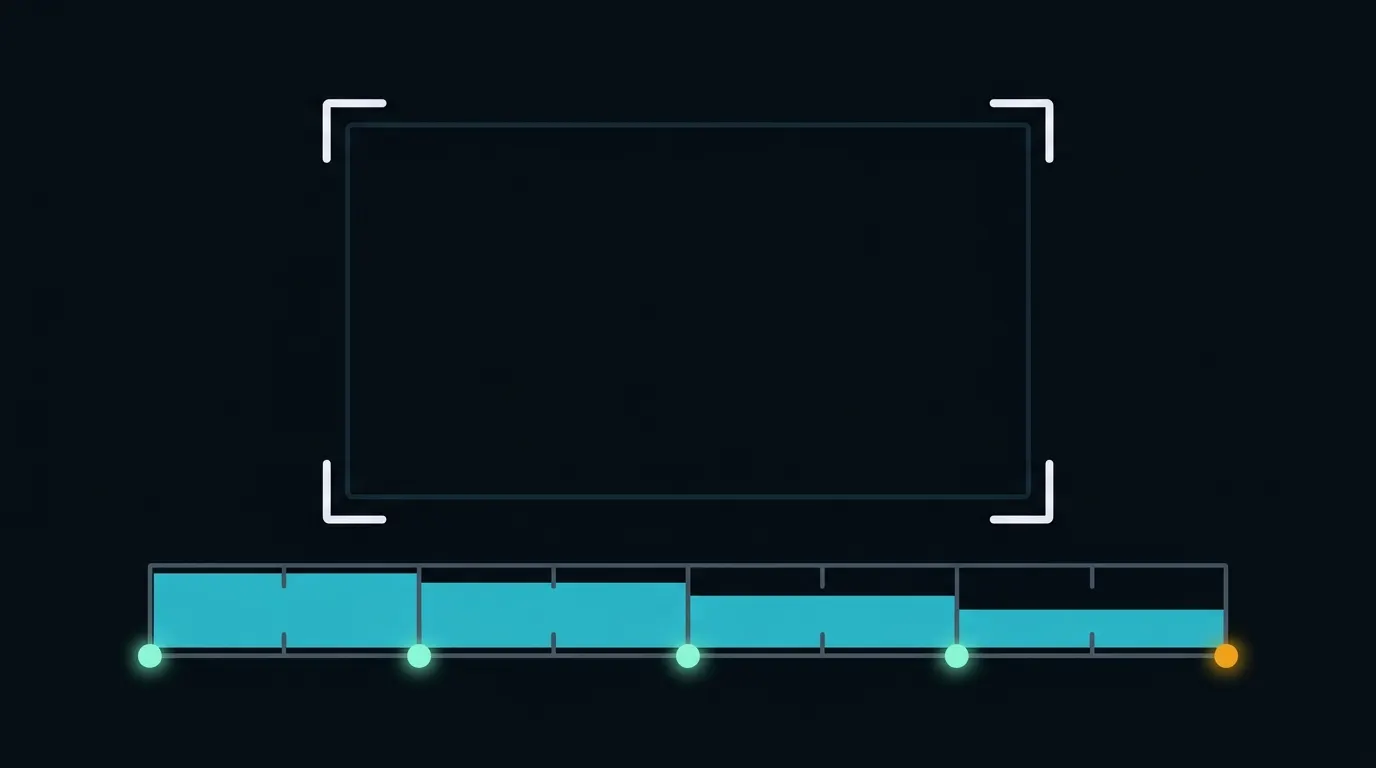
A single completion figure hides the shape of the drop-off. Quartile counts show it: if most of the loss happens before the first quartile, the opening is the problem; if it happens late, the ending or the length is. Google Ad Manager combines the quartiles into an average view rate, a weighted measure of how much of the video was watched, and reports average view time as total viewing time divided by starts, where view time stops if the viewer drags the timeline backward or stops the video. On YouTube, the audience retention report goes further for each video: it shows what share of viewers were still watching after the first 30 seconds, and marks spikes where parts were rewatched or shared and dips where viewers abandoned or skipped. For any library, the most useful question is the same: at which second do people leave, and what is on screen at that moment?
Why completion varies by format and placement
Completion rate is not a property of the content alone. Length changes it most: a 15-second clip and a 10-minute programme cannot be compared on the same scale. Placement changes it next: a muted video that starts on its own in a feed, a preview on a homepage tile and a video a viewer clicked to play describe very different intentions, even when each one counts as a start. Skippable formats add another cut-off; in Google Ad Manager the skip button appears 5 seconds after a skippable ad starts. A complete also does not mean the video was seen or heard. VAST's complete event says the creative played to the end at normal speed, nothing more. Viewability is measured separately: the IAB's 2014 guidance on the Media Rating Council standard treats an in-browser video ad as viewable when at least 50 percent of it is in view for at least 2 seconds. A video can complete in a background tab or below the fold, so read completion next to viewability and sound status where the player reports them.
Common measurement mistakes
Mixing denominators across tools is the most frequent one: a rate on starts from the player and a rate on impressions from an ad server will never agree. Counting autoplay starts and click-to-play starts together hides two different audiences. Looping videos either never fire an end event or count one viewer several times, depending on how the player is built. Seeking to the end can trigger a complete without much viewing, which is why the VAST quartile events require continuous playback at normal speed. Live streams have no fixed end, so completion rate does not apply; use watch time and concurrent viewers instead. Missing data is normal too: Google notes that some viewership metrics can vary because tracking pings are lost on mobile networks. Finally, a rising completion rate can come from shorter videos rather than better ones, so always report the duration mix alongside the rate.
How to use completion rate in decisions
Treat completion as one depth measure among several. Starts and click-through describe whether people chose to watch. Watch time and quartiles describe how much they watched. Completion tells you whether a piece held attention to the end, which matters most for short clips, trailers, recaps and sponsored segments where the message or the call to action sits near the end. Compare like with like: the same placement, the same device class and similar lengths, ideally in a controlled test between the current and the new experience. YouTube's own report takes this approach by comparing a video's retention with your recent videos of similar length. When a change raises completion, check that starts and total watch time did not fall at the same time; a shorter clip that fewer people start is not automatically an improvement.
Where Minute-ly.com fits
Minute-ly.com generates video products such as Top Videos, Video Previews and vertical versions through Smart Composition, and its Analytics separates the questions these metrics answer: impressions describe exposure, plays and sessions describe consumption, watch time, time spent per session and completion describe depth, and click-through and interactions show actions. Teams can monitor generated assets and compare performance by product, content and destination. The available reporting fields and the event integrations for web, apps and OTT are agreed before launch, so that completion is defined the same way for the generated experience and for the one it is compared with.
Checklist
Write down the completion definition each tool uses: the start event, the complete event and the denominator. Report counts as well as percentages. Separate autoplay from click-to-play, and in-feed from in-article placements. Group videos by length before comparing them. Decide how loops, replays and seeks are counted, and record each milestone once per view. Use quartiles or a retention curve to find where viewers leave, then look at what is on screen at that second. Read completion next to starts, watch time, viewability and sound status. Exclude live streams. Test changes against a comparable control, and check that a higher completion rate did not come with fewer starts or less total viewing.